Afghanistan Earth Quake Analysis Using Radar Remote Sensing
On Wednesday, 22nd June morning, an earthquake of magnitude 5.9 was clatter in eastern Afghanistan, destructing Khosat and Paktika provinces. The earthquake produced an extreme trembling as it initiated at a shallow depth. Gayan district took intense damage. Hundreds of homes were destroyed, many people were killed and many more injured.
We have used a remote sensing technique SAR Interferometric Technique, to find the center of the earthquake and surface deformation map. For that, we have used Synthetic aperture SAR images acquired by Copernicus Sentinel-1image (18 June 2022 and 30 June 2022). This Technique will compare two SAR Images acquired at the same location but at different time (before and after the earthquake) and find the phase difference.
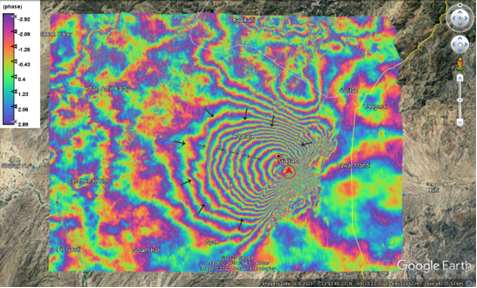
Figure 1. Interferogram
Figure 1 represents the interferogram map. The Phase change in the radar wave, before and after the earthquake is represented using a different color in an interferogram. The colored contours represent the interference fringes between the two sets of data. Greater deformation occurs in a region where fringes are closer together. The closest fringes show the source of an earthquake.
According to our analysis, the center of the Earthquake is Gayan as the fringes are closer in this area, and the magnitude of deformation is about 33 cm.
To find whether the surface is moved up or down we will count the fringes from the outside to the inside of the concentric pattern. if the pattern goes blue-purple -yellow its means the surface has moved down and when the pattern is from blue-yellow -to purple it means the surface has moved up. According to our study, the fringes pattern is from blue-yellow- purple as shown in figure-1, that means the surface has moved up.